

Introduction
It's peak tornado season here in Indiana, and if you live in this part of the country you know the drill: you've got the radar app open on your phone, the TV weatherman is tracking a supercell, and if you’re a nerd like me, you have a weather station in your backyard. You're not just waiting for something to go wrong, you're building a continuous picture of what's happening right now and getting alerted the moment something changes.
That's observability.
What Is Observability, Really?
Observability is your ability to understand the internal state of a system from the outside. In practice it comes down to two things:
Current state: What does the system look like right now? Are my workloads protected? How much storage do I have left? Is every cluster online? This is the radar image on your screen. You have to actively go look at it, but it gives you a complete snapshot.
State changes: What just happened? A backup failed. An anomaly was detected. A user's role was elevated. This is the tornado warning that buzzes your phone. You don't poll for it, it finds you.
Good observability means you have both. Polling gives you the full picture on demand. Event-driven push tells you when something worth paying attention to just happened.
Rubrik Security Cloud exposes both patterns.
The Two Patterns: Poll and Push
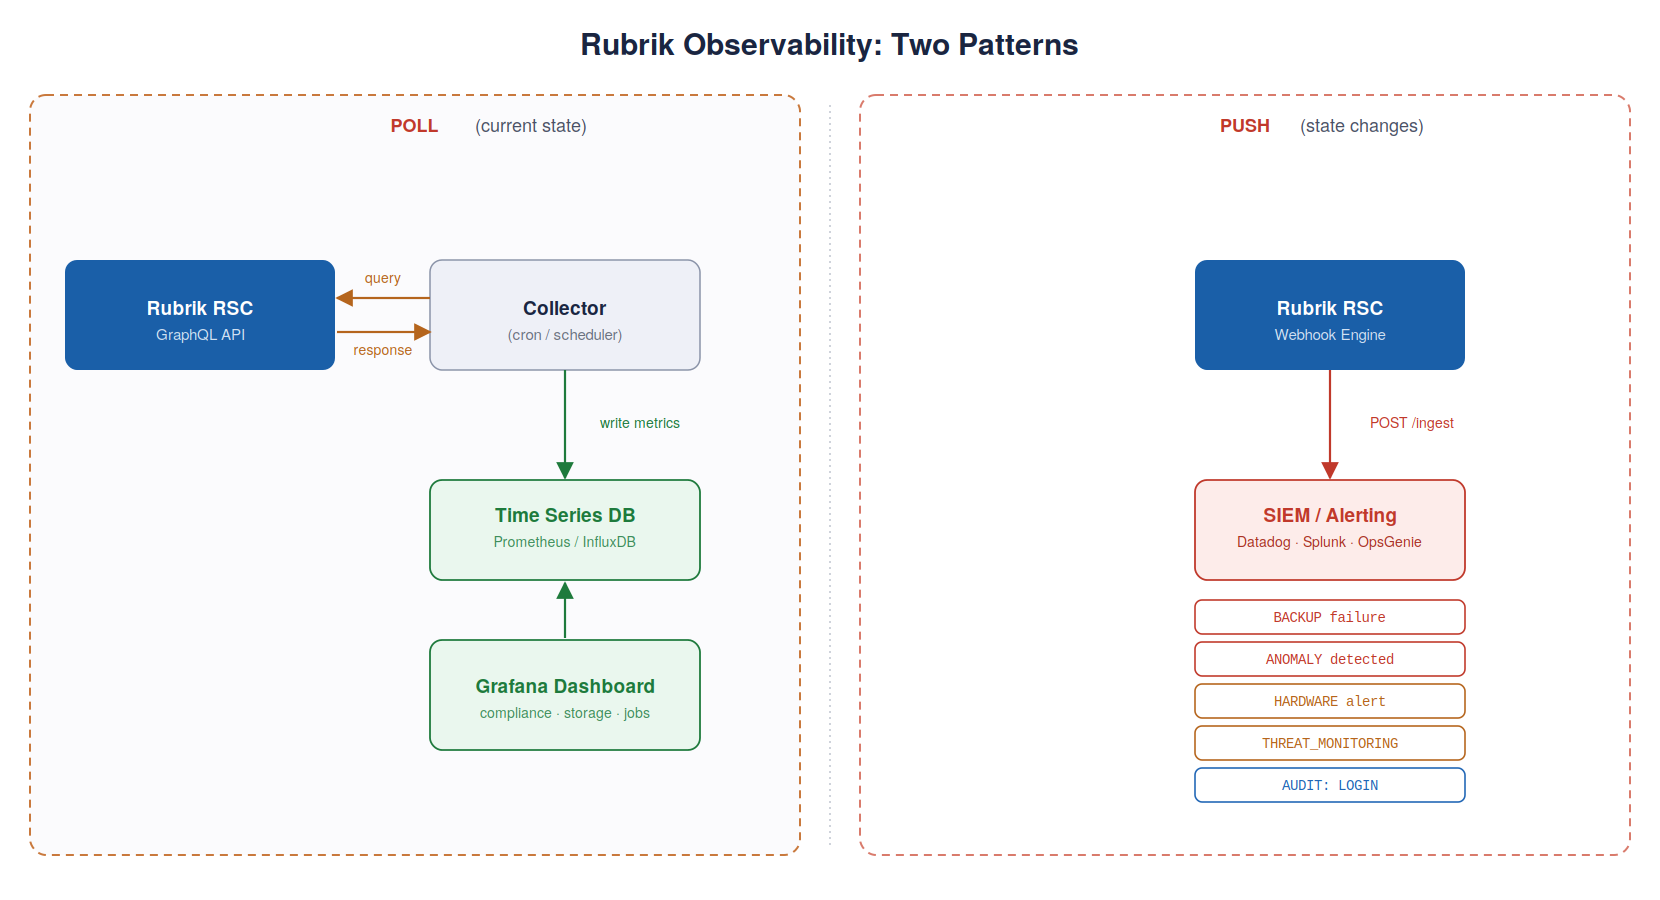
Polling Current State
The RSC GraphQL API gives you rich point-in-time data you can query on any schedule. The two most useful queries for observability are:
activitySeriesConnection() Your window into backup and recovery job history. Filter by time range, object type, severity, and status to build dashboards showing what ran, what succeeded, and what failed. Each record includes structured failure detail (failureReason, causeErrorCode, causeErrorRemedy) so you can surface actionable context without a human having to log into Rubrik.
snappableConnection() Your compliance and protection status view. Returns every protected workload with its SLA domain assignment, compliance status, last snapshot date, and missed snapshot count. Filter on complianceStatus: OUT_OF_COMPLIANCE to power a "things that need attention right now" dashboard.
Full documentation and working GQL examples: developer.rubrik.com — Events & Observability
Listening for State Changes: Webhooks
Polling is powerful, but some signals need to reach you now, not on the next five-minute cron tick. That's what webhooks are for.
Webhooks can be set up via the RSC console or the API. The Events & Webhooks guide on developer.rubrik.com covers both. Once configured, RSC fires an HTTP POST to your endpoint each time a matching event occurs.
What lands in the payload is where things get useful. The default payload includes:
- ActivitySeriesId: The correlation ID. Use this to tie events together to understand the series of discreet events of a particular job.
- ActivityType and Status: What happened and whether it succeeded
- Severity: SEVERITY_CRITICAL, SEVERITY_WARNING, or SEVERITY_INFO
- Error fields (ID, ErrorCode, Remedy, Message): Structured failure detail with actionable remediation text
- Time: RFC3339 timestamp of when the event occurred
- logicalSizeInBytes, dataTransferredInBytes: Data movement context for backup events
The payload format is fully customizable via Go Templates. You can reshape the JSON to match whatever your downstream tool expects whether it is Datadog, Splunk, PagerDuty or building a generic envelope and route by ActivityType.
A couple of things worth knowing about subscriptions:
- Event and audit streams are separate. Operational events (backup, anomaly, hardware, threat) and identity/access events (logins, role changes) use different subscription inputs. Configure both for complete coverage.
- SEVERITY_INFO fires on every successful job. In a large environment that's thousands of events per hour. Subscribe to Critical and Warning unless you specifically need success confirmation.
Integrating with Your Observability Stack
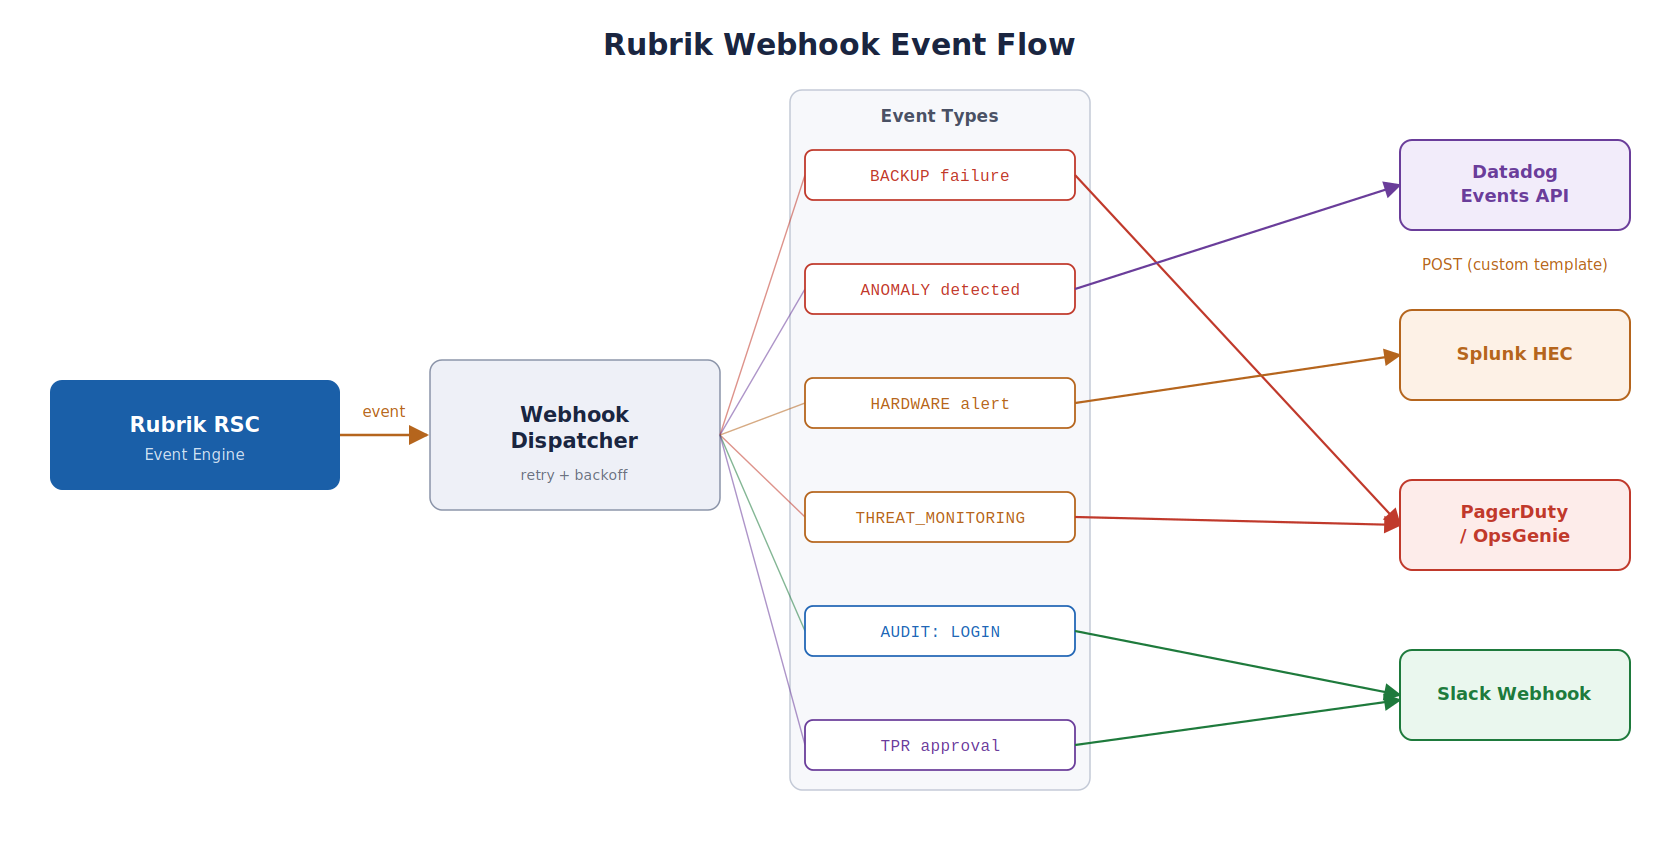
Datadog
Rubrik ships a pre-built Datadog webhook template that formats events into the Datadog Events API v2 payload shape. You create the webhook in RSC, point it at the Datadog API endpoint, and events start flowing into your Datadog event stream automatically.
{
  "aggregation_key": "{{.ActivitySeriesId}}",
  "title": "{{.ActivityType}} - {{.Status}}",
  "text": "{{.Error.Message}}",
  "alert_type": "{{if eq .Severity \"SEVERITY_CRITICAL\"}}error{{else}}warning{{end}}",
  "source_type_name": "rubrik"
}
From there you can create monitors that page on-call when backup failures spike, or build a service-level dashboard showing compliance percentage by business unit. The template example is in the Events guide.
Splunk
For Splunk, point your webhook at the Splunk HTTP Event Collector (HEC) endpoint with a custom template that maps Rubrik's payload fields to Splunk's expected format. The activitySeriesId field is particularly useful here. When a webhook fires, use that ID to pull richer event detail from the API and enrich the Splunk event before it lands in your index.
PagerDuty / OpsGenie
Route SEVERITY_CRITICAL events directly to your incident management platform. The default webhook payload includes errorId, errorCode, and errorRemedy, if you include the remedy text in the PagerDuty alert body, your on-call engineer will have actionable context before they even open a browser.
Building a Metrics Collector with Time Series Output
Webhooks handle the "alert me when something changes" half of observability. For trending, capacity planning, and compliance reporting over time, you want to poll on a schedule and write results to a time series database.
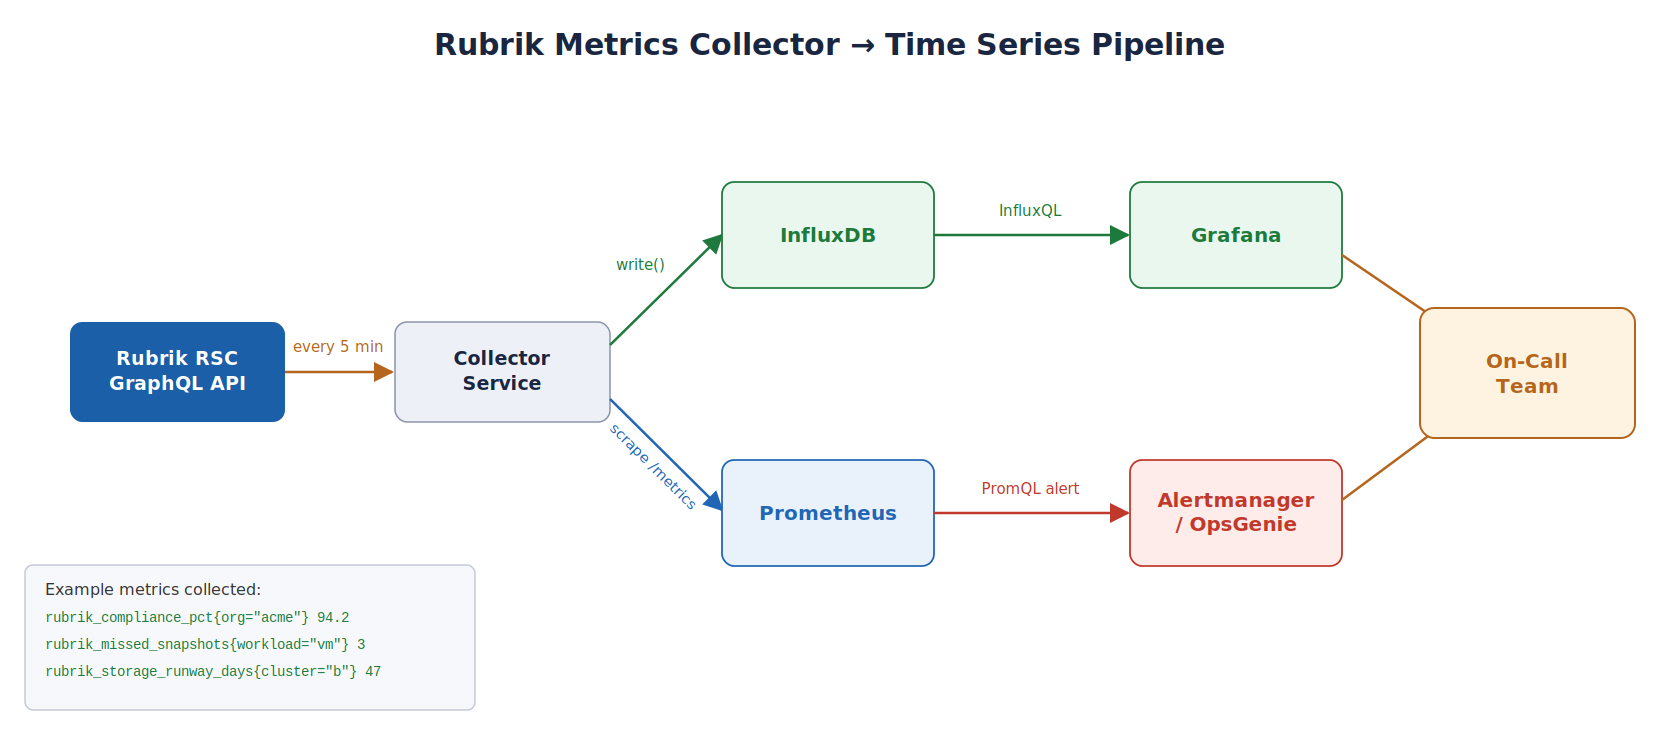
A simple collector loop using the RSC Python client:
from rsc import RSCClient
from influxdb_client import InfluxDBClient, Point
from datetime import datetime, timezone
import time

rsc = RSCClient()
influx = InfluxDBClient(url="http://localhost:8086", token="...", org="ops")
write_api = influx.write_api()

WORKLOADS_QUERY = """
query ObservabilityPoll($after: String) {
  snappableConnection(
    first: 1000
    after: $after
    filter: { protectionStatus: Protected }
  ) {
    nodes {
      id
      name
      objectType
      complianceStatus
      missedSnapshotCount
      slaDomain { name }
      physicalBytes
      cluster { name }
    }
    pageInfo { hasNextPage endCursor }
  }
}
"""

def collect():
    cursor = None
    points = []
    while True:
        result = rsc.execute(WORKLOADS_QUERY, variables={"after": cursor})
        data = result["snappableConnection"]
        now = datetime.now(timezone.utc)

        for node in data["nodes"]:
            p = (
                Point("rubrik_workload")
                .tag("cluster", node["cluster"]["name"])
                .tag("object_type", node["objectType"])
                .tag("sla", node["slaDomain"]["name"] if node["slaDomain"] else "none")
                .tag("compliance", node["complianceStatus"])
                .field("missed_snapshots", node["missedSnapshotCount"] or 0)
                .field("physical_bytes", node["physicalBytes"] or 0)
                .field("is_compliant", 1 if node["complianceStatus"] == "IN_COMPLIANCE" else 0)
                .time(now)
            )
            points.append(p)

        if not data["pageInfo"]["hasNextPage"]:
            break
        cursor = data["pageInfo"]["endCursor"]

    write_api.write(bucket="rubrik", record=points)
    print(f"Wrote {len(points)} workload metrics")

while True:
    collect()
    time.sleep(300)  # poll every 5 minutes
With this data in InfluxDB, a Grafana dashboard can show:
- Compliance % over time - did a maintenance window cause a dip last Tuesday?
- Missed snapshots trending - is a particular cluster's workloads consistently falling behind?
- Storage growth rate - per cluster, per SLA, per object type
- Capacity runway - days until storage exhaustion, projected forward
For Prometheus users, expose the same metrics on a /metrics endpoint using the prometheus_client library and let Prometheus scrape it. The alerting rules then live in Alertmanager alongside the rest of your infrastructure alerts.
Key Signals to Watch
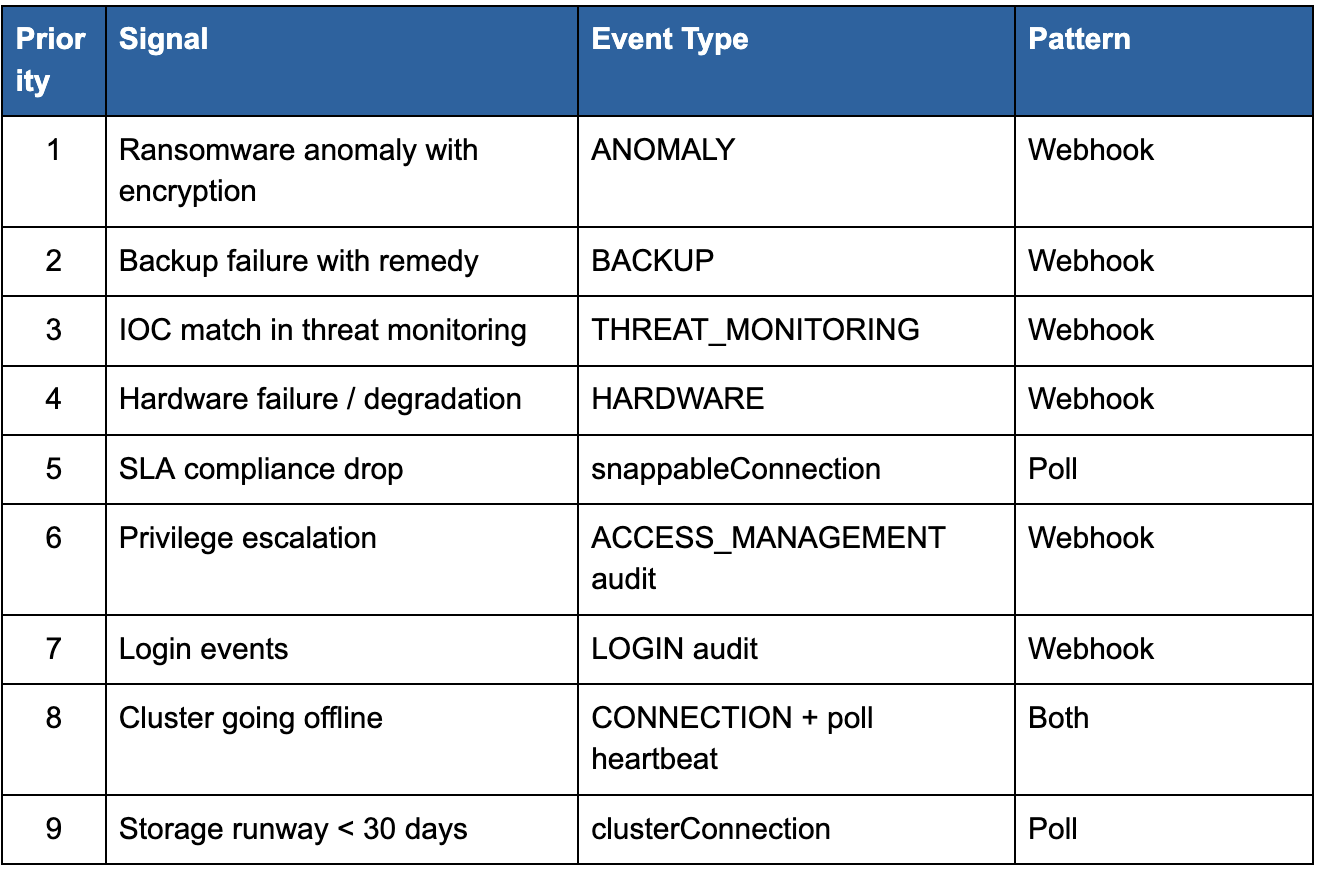
One operational note on cluster connectivity: if a cluster goes completely offline, it cannot send events to RSC — including failure events. Complement your webhook subscription with a polling heartbeat that checks clusterConnection() and alerts if any cluster shows DISCONNECTED. Silence is not the same as healthy.
Where to Go Next
Everything you need to build on these patterns is at developer.rubrik.com:
- Authentication: Service account setup and token lifecycle
- Events & Webhooks: Full webhook reference, payload structure, custom templates, retry policy
- Workload Metrics: snappableConnection field reference and compliance polling examples
- Threat Monitoring: IOC match queries, anomaly detection fields, threat hunt results
- API Playground: Interactive GraphQL explorer, no code required
The RSC API is a single GraphQL endpoint. It gives you one place to authenticate, one place to query, like pulling backup job history, checking compliance, subscribing to threat events, or exporting metrics to your TSDB of choice.
Build the radar. Don't wait for the tornado.
Questions? The RSC API docs are the starting point for all of this because that's where you'll find authentication, the schema reference, and working code samples.
Contributed by

Jake Robinson
Sr. Developer Relations Manager, Rubrik

