One of our main values is to deliver world-class customer experience. This entails actively engaging with customers to better understand their needs and to build products with the user in mind. An important tool for this type of engagement is a system reporting framework that allows our software to actively report data and to ensure we take the best possible course of action to continuously improve customer experience and the quality of our product.
The Importance of Proactive Customer Engagement
While proactive monitoring is not a new concept, many companies still rely on reactive support. Reactive customer engagement is expensive and time-consuming while proactive engagement focuses on non intrusive, metric-based optimizations to the performance of a product. At its core, it emphasizes an ongoing, elevated customer experience. Additionally, a proactive strategy requires cross-functional collaboration to drive success.
At Rubrik, we monitor data in real-time and leverage analytics to:
- Predict customer needs before they even happen
- Optimize and analyze the performance of our software
- Alert for abnormal behavior to improve product quality.
In summary, it allows us to understand how our services are performing, identify potential areas of risk, and obtain a holistic view on the overall health of our systems – 7 days a week, 24 hours a day, 52 weeks a year. This led to the creation of our alerting framework – Jarvis. This framework is how we process the large amount of data collected from real-time stats and log reporting into an intelligent, actionable alerting system.
Introducing Jarvis, Our System Alerting Framework
Meet Jarvis. Jarvis is the architecture we created to deliver an intelligent, proactive system that monitors the health and quality of our software. Our objective is to ensure that 1) we can engage with a customer immediately when there is an issue, 2) improve the quality of our software; and 3) proactively monitor our system even when the alerts received are not actionable by the customer. While we have built our system to be fault-tolerant, it is essential that we enhance the performance and efficiency of our software even if it doesn’t directly affect the customer, such as if we notice a scheduled backup job is taking a long time or if a node is failing.

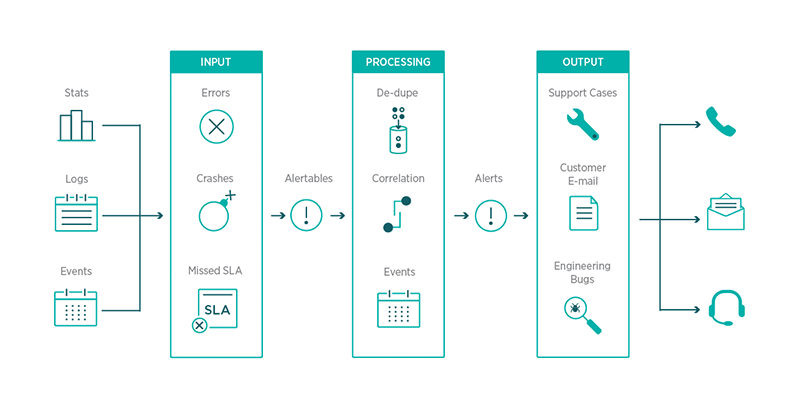
The infrastructure behind our framework is cloud-scale, reliable, and fault-tolerant. The key phases of this framework are inputs, processing, and outputs.
Inputs
Rubrik nodes report various types of information, namely logs, stats, and events. The primary role of the input phase is to normalize data from the various sources into events called “Alertables”. An alertable is an event that requires further action based on the criticality and implications of the data reported. For example, “high CPU usage” would be an alertable. Each alertable event can have subsequent information added to it for later processing. All the alertables are stored in a database which are later queried in the processing stage.
Processing
The processing stage is used to correlate various alertables into specific alerts. The goal is to monitor the large amount of data and narrow down and group events that bring us to the key issue requiring attention. In several cases, this a simple one-to-one mapping. For instance, if a cluster is reporting a high CPU, you want to create a single alert for that incident. However, there are cases where we want an alert to be cross-cluster as well. In addition, the processing stage helps us deal with certain alert dependencies, such as “do not fire alerts while a cluster is upgrading.”
Outputs
Based on the alerts generated by Jarvis, the system creates an output to various external systems based on the use case, such as support tickets, a developer bug, or an email to a customer.
A Real-Life Example
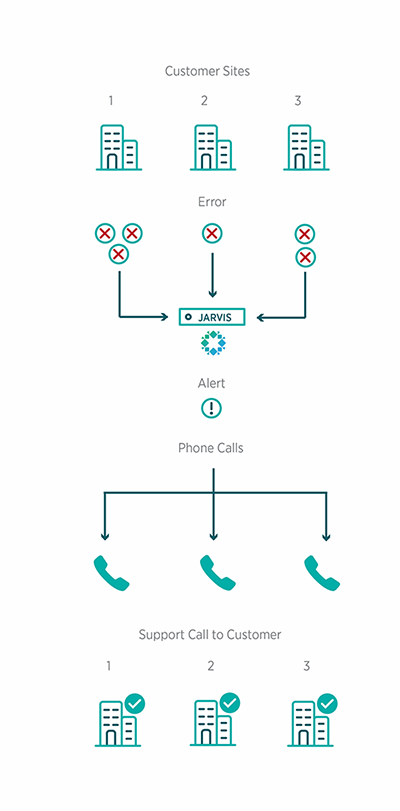
To illustrate this workflow process, let’s take a look at an example. In one situation, we were experiencing an issue where we saw our system locking up due to node reboots.
- Inputs: We were able to trace down the issue into a kernel error for logs in Linux, which we then matched to a specific log line signature.
- Processing: Once we knew the signature, we could quickly identify which clusters were affected. Our system de-deduped the inputs so that instead of multiple alertables for each cluster, there was only one alertable per cluster. This created an alert by consolidating all alertables across customers into one common issue. Additionally, any new occurrence of this particular issue would be grouped into that existing alert.
- Outputs: Once we had the alerts, we contacted support, who was able to quickly reach out to the affected customers. The solution was a simple upgrade of their system.

Since our system is fault-tolerant, the customers never saw the failed jobs. However, we noticed occasional failures and were able to diagnose the problem before it became a larger issue. With our framework, we were able to identify the scope, frequency, and severity of the issue. Once we consolidated all the alerts across clusters into one alertable, we were able to see that the issue was with the Linux kernel and required a simple software upgrade.
Delivering Optimal Customer Experience
We are continuing to develop our system alerting framework to improve the efficiency and quality of alerts. We strive to anticipate customer needs and deliver the optimal performance and experience. Look out for our follow-up post where we will explain how we built the architecture behind Jarvis and how we leverage the cloud for predictive and proactive support.
