Today we announced version 3.1 of the Rubrik Cloud Data Management platform. This is our seventh product release, and it builds on prior releases to support common enterprise environments, including: VMware virtualized environments, NAS, Linux and SQL databases, and remote offices. 3.1 extends our focus on enabling customers to capitalize on the agility of the cloud, heighten security, and leverage rich analytics to optimize operations.
That’s why we’re excited to introduce Rubrik Envision, our customizable visual analytics and reporting tool. With Envision, customers can easily create and share detailed reports for platform analytics on data protection, compliance, and capacity utilization.
Within an easy-to-use interface, here is how Envision delivers on-demand, actionable insight for enhanced data management:
Customized Reporting
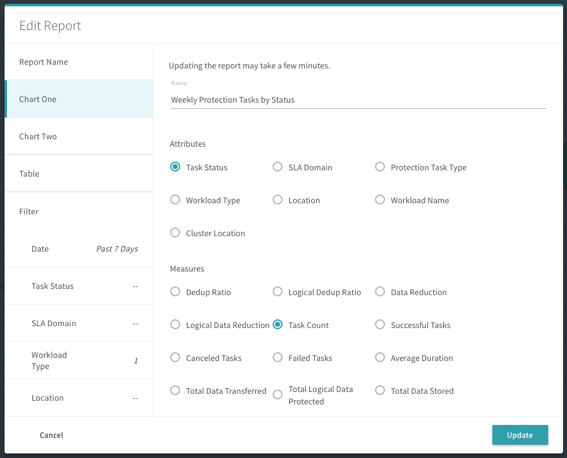
Envision makes relevant data accessible to anyone from backup admins to IT directors. Easily customize pre-canned reports or create your own to monitor a cluster—all within the Rubrik web UI.

There are over 15 attributes and nearly 40 measures available. In addition, use filters to determine which pieces of data should be included in a report. These elements deliver granular monitoring of your VMs or physical hosts. As a starting point, we offer these four system-built reports:
- Protection Tasks Summary: Weekly number of protection tasks by status, the status of weekly tasks by SLA domain, and a summary table.
- Protection Tasks Details: Daily number of protection tasks by status, daily failed tasks by workload name, and a summary table.
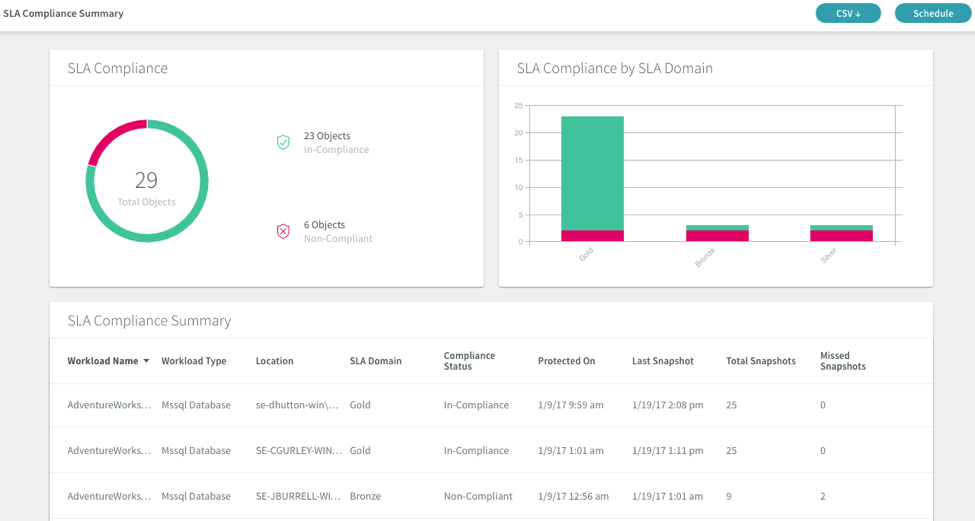
- SLA Compliance Summary: Total number of data objects that are in SLA compliance, their status by SLA domain, and a summary table.
- System Capacity: Usage of local storage by SLA domain, the usage growth over time by SLA domain, and a summary table.
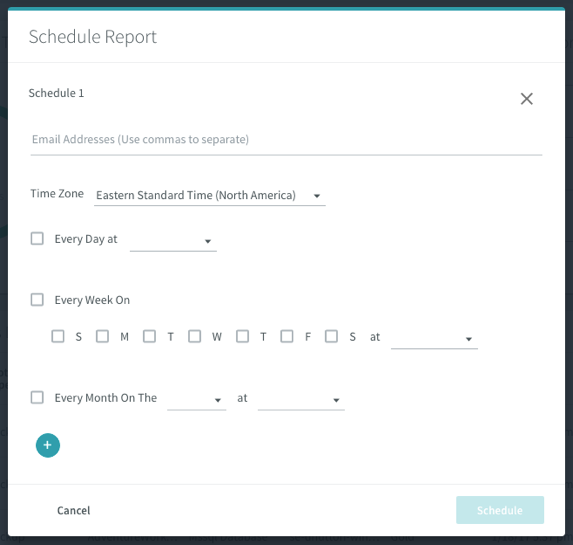
Aligning with Rubrik’s other products, we designed reporting to require minimal management. Have scheduled reports automatically emailed in an easy-to-read HTML5 format, and download on-demand reports. Any report can be saved into your Gallery and quickly located with a search function.

Advanced Charting
Since we’re a design-centric company, how data is represented via our platform is a top priority. Envision provides customizable visualization with advanced charts. Pick from a variety of charting widgets—such as a donut, bar, or line chart—to display your data. For users with no preference, the system can select a widget with its intelligent default settings.
As shown below, reports and charting have the same look and feel as the Rubrik UI.

Use Cases
The flexibility behind Envision is meant to support a variety of use cases.
In addition to fulfilling standard data protection needs for IT admins (daily report on task failures, weekly summary highlighting tasks based on SLA domain), Envision is well suited for audit committees; an auditor may choose a subset of clients at random and can quickly obtain detailed reports over a specific timeframe. For businesses with remote sites, regular reports can show how up-to-date an office is in case of disaster recovery.
These are just a few of the many use cases Rubrik Envision can satisfy. The intention behind this customization is that it can aid any user, anywhere. But despite the innumerable reporting possibilities, Envision preserves the simplicity that Rubrik users have come to know and love.
Want to learn more? Register for our April 6th webinar on Envision.
