The Rubrik CDM and Rubrik Polaris platforms are built on top of a rich suite of RESTful APIs, allowing easy integration with third-party services. Many Rubrik customers are also Splunk customers, so pairing the two systems is a natural fit. Our customers use Splunk to aggregate logs from across the numerous pieces of hardware and software running in their infrastructure. This allows administrators to centrally report everything and correlate events happening throughout their environment in order to provide insights and reduce fault resolution times.
As a result, we have engineered and released a Splunk add-on and application that can be used to surface data points from the Rubrik CDM and Rubrik Polaris platforms into Splunk. You can easily find the Splunk Add-on for Rubrik in the Splunkbase. This initial version of the add-on pulls data from both the Rubrik CDM and Rubrik Polaris platforms via REST API to present:
- Event data – security, replication, backup, recovery, archive, and more.
- Capacity statistics and trending.
- Backup and recovery histories and trending.
- Ransomware detection events via Rubrik Polaris Radar.
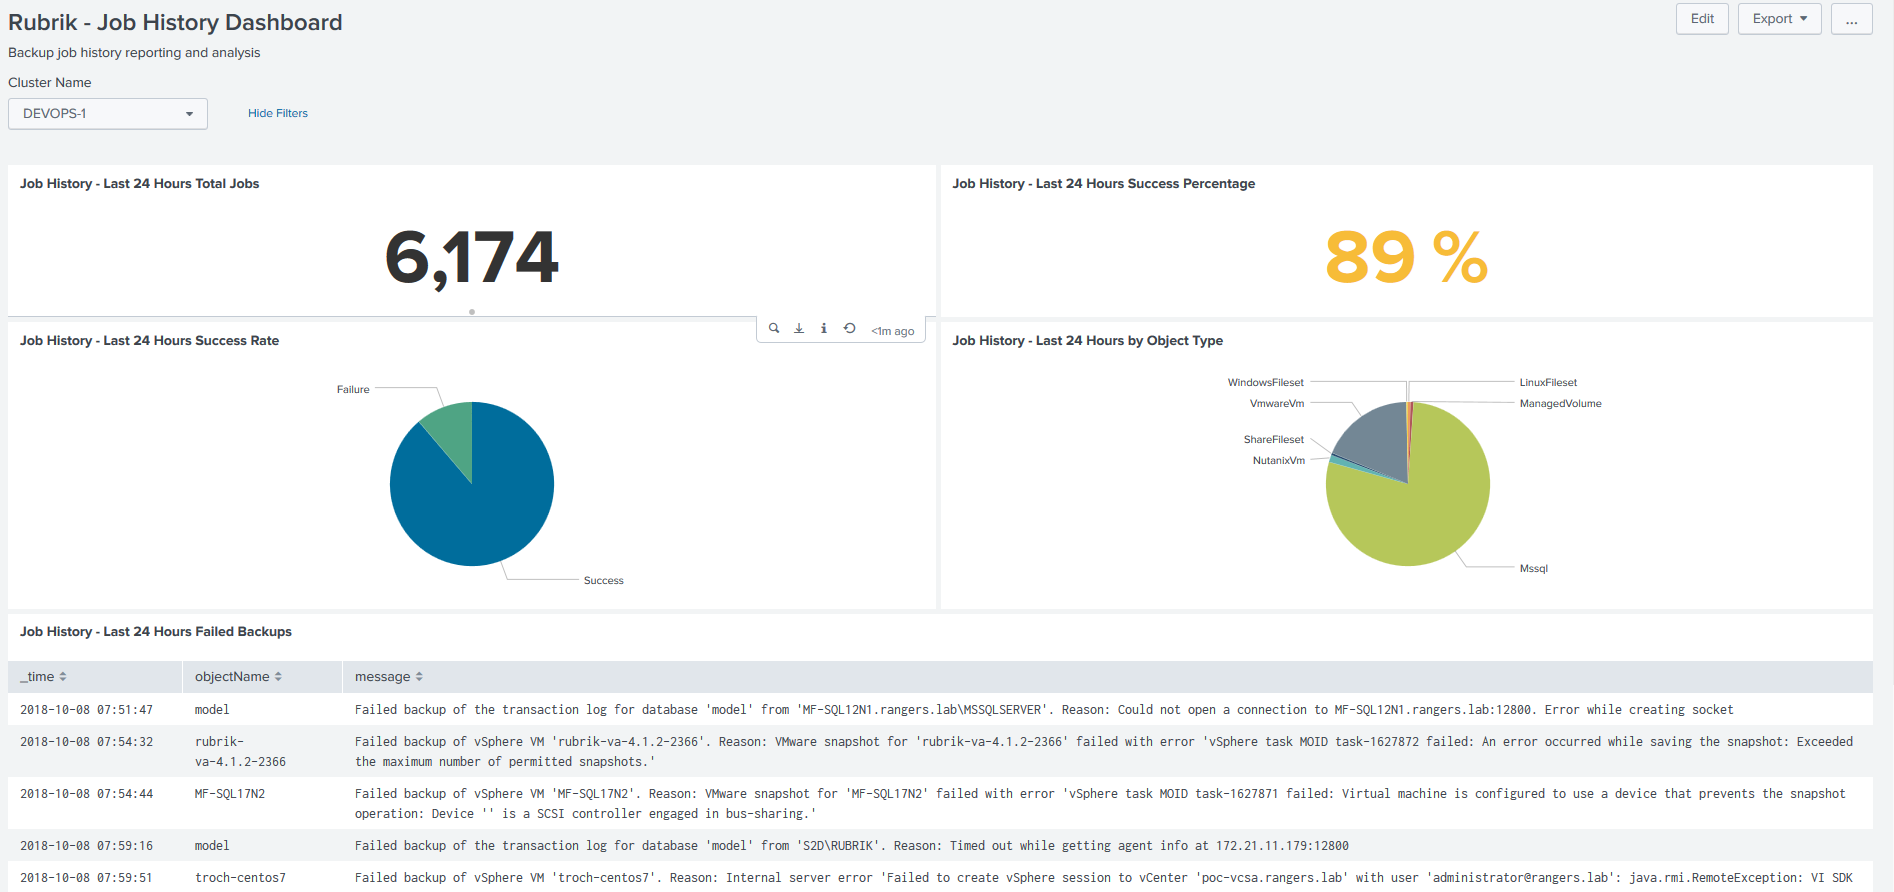
Here’s an example of a Rubrik job history dashboard:

The Splunk Add-on for Rubrik provides many advantages to customers, such as the ability to:
- Visualize the operational status of the Rubrik system through dashboards.
- Report on security events, both through our ransomware detection and security audit events on Rubrik CDM clusters.
- Easily manage and report on capacity across multiple Rubrik clusters.
- Quickly identify backup job success and failure rates, providing at-a-glance data on failures.
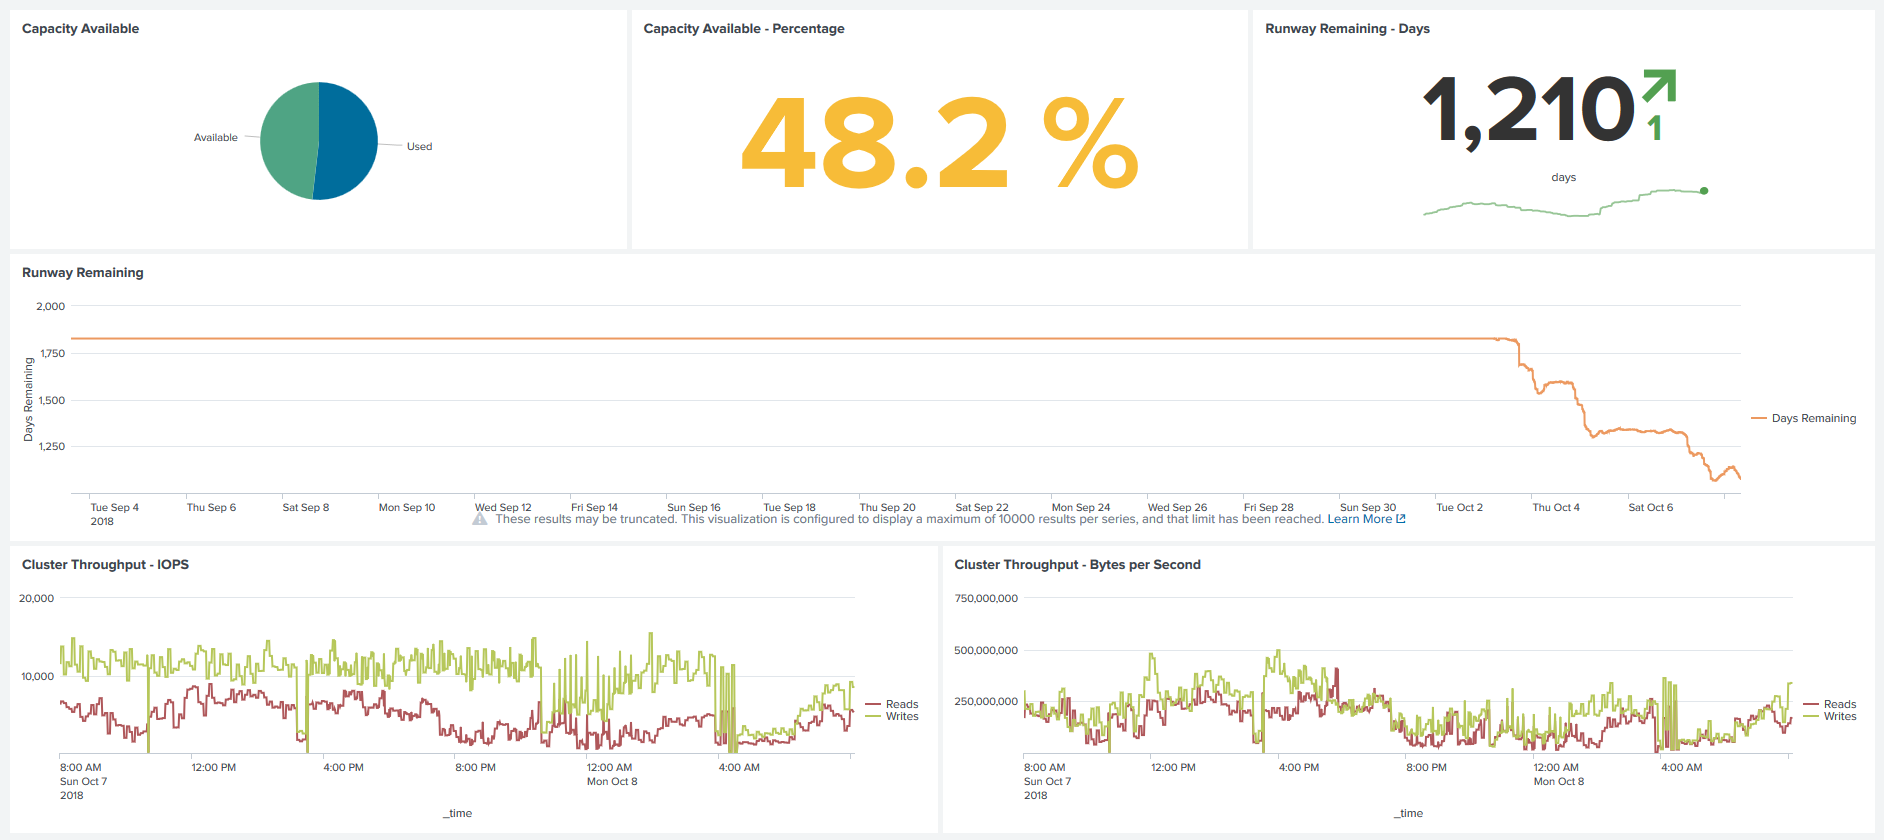
The below dashboard provides further examples of monitoring Rubrik capacity and runway through Splunk:

This dashboard provides information on:
- Capacity remaining on the Rubrik cluster.
- Tracking capacity over time.
- System IO and throughput statistics over time.
Make sure to check out the GitHub repository for this project to find the documentation and more information!
