Your company runs cloud infrastructure on AWS and it wants to reduce the spend. You’ve already got a Savings Plan in place, you’ve right sized your instances, but when you look in Cost Explorer, the spend is still too big to believe, what do you do?
If you take one thing away from this post let it be this – your objective should be to understand your costs. While reducing costs is important and valuable, reduction only comes as a consequence of understanding.
The value of understanding cloud costs is something we at Rubrik discovered firsthand on our journey to reduce our bills. Below we’ll share anecdotes demonstrating our approach to achieving an understanding of our cloud spend, concrete examples of both successes and failures, and the learnings we picked up along the way. These stories will include how:
- Accurate attribution led to a speedy 10x reduction in a major account.
- Dogfooding led to a bug discovery, a fix, and corresponding savings.
- Using APIs and histograms allowed us to come to grips with reality.
- Process failure can be as important as software bugs.
- Rearchitecting resulted in a 600x reduction in CI/CD cost.
At the core of success is a model identifying what is driving the costs: what will it cost if we onboard 10K more customers? 1K more developers? 500 more test cases? A successful business must be able to predict costs as it scales on different dimensions, which is not possible without a model.
While this post and the scenarios described focus on AWS, the lessons should apply generally across any infrastructure you pay for, whether it be in the cloud or your own datacenter.
Accurate Attribution Leads to Cost Savings
It is difficult to properly model spend without knowing details about the resources generating cost. Every resource must have a clearly defined owner who can answer questions about the purpose of a resource and justify the reason for its existence. In some scenarios, this is relatively simple to do, such as with owners of a linked account or organizational unit. However, it is not always possible to discern ownership at this level.
The Rubrik developer infrastructure team, Stark, hosts a multi-cloud resource management system named Bodega. This framework creates resources in a shared AWS account on behalf of the developers responsible for building the product. These resources are used to test and qualify the code and services being developed for our customers.
To attribute spend within our AWS accounts, we use the inbuilt AWS tagging system, to associate custom key/value pairs with resources. We then enable them as User Defined Cost Allocation Tags, which allows them to become usable as a dimension in the Cost Explorer. Our resource manager Bodega is an authenticated service, which propagates the requesting user as the Cost Allocation Tag Owner when it assigns a resource.
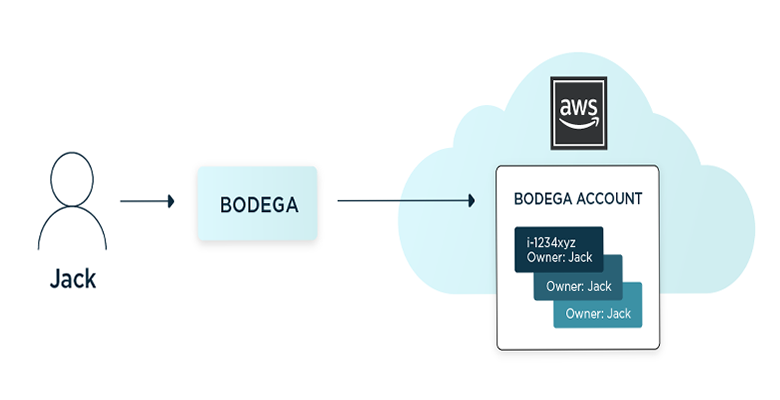
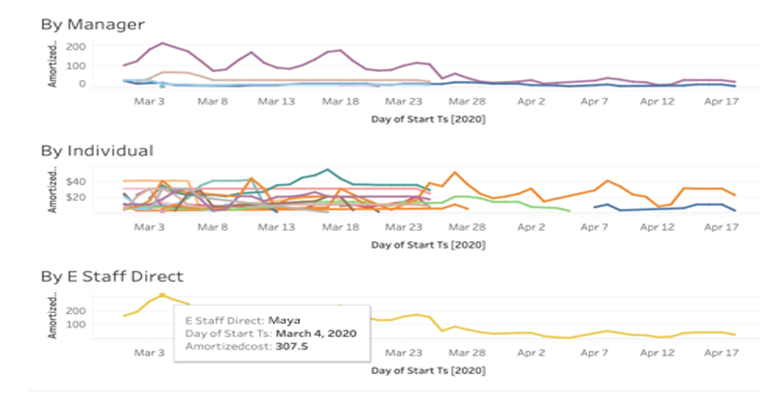
Investigation revealed Bodega served resources to be a significant driver of our AWS costs. We used the Cost Explorer API to pull spending data aggregated by the Owner tag into Snowflake, a data warehouse service, in order to join with our organizational chart from Workday. Finally, we built visualizations in Tableau of the spend by the manager, director, etc.
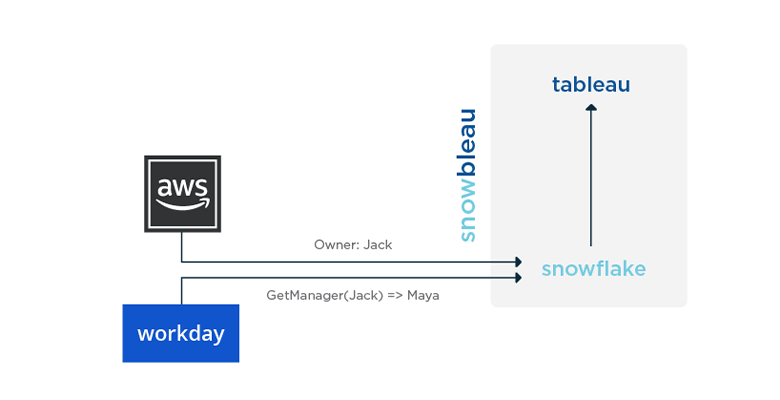
Simply by attributing and surfacing the data we saw our top spending org reduce its daily spend by 10x in less than a month. Using APIs combined with Snowflake and Tableau – which we endearingly refer to as #snowbleau – FTW!
Dogfood: Get Bill, Find Bug, Fix Both
A tried and true strategy for improving product quality is to Eat your own dogfood, whereby you become your own customer zero. One example at Rubrik is our use of Rubrik Polaris Cloud Native Protection to backup mission critical DevOps infrastructure running on AWS.
Because we’re using a product whose architecture and implementation we understand, we’re able to model the resource consumption. In this case, we know Rubrik Polaris is going to apply a backup policy called an SLA Domain with a specific snapshot cadence and garbage collection logic. For example: Take a snapshot once a day, save daily copies for a week, weekly copies for a month, monthly for a year…Given the above, we’d expect something like 7 + 4 + 11 = 22 snapshots covering a year, not 365. The specific policy doesn’t particularly matter in this example, the important takeaway is that we expect sub-linear growth in the number of snapshots over time.
Also, Rubrik takes incremental snapshots. The first snapshot will be a “full” and snapshots thereafter will be stored as increments or deltas off a “full.” The storage cost is proportional to the change rate, not the absolute size of the object being snapshot.
Given these two factors, sub-linear growth in the number of snapshots and significantly less storage consumed by incremental snapshots, our mental model should tell us to expect the majority of the resource consumption to happen almost immediately after protection has begun and then should plateau or grow very slowly thereafter.
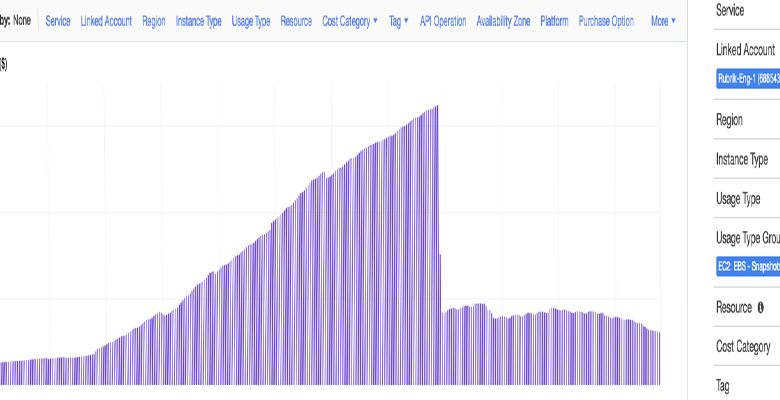
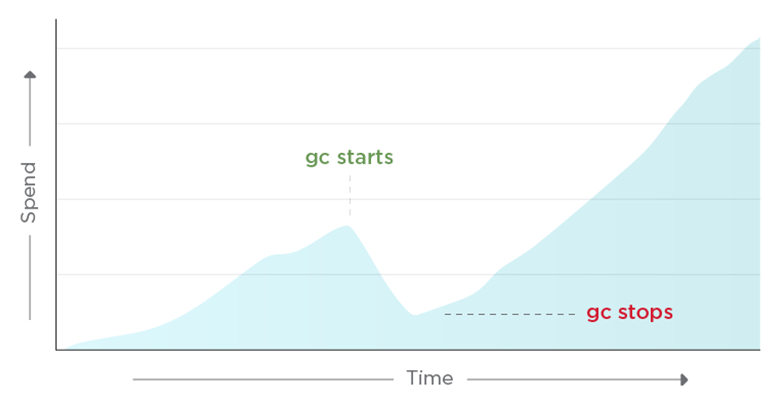
However, this is what the spend on EBS Snapshots looked like in this account in Cost Explorer (hint: up-and-to-the-right is not what we want to see).
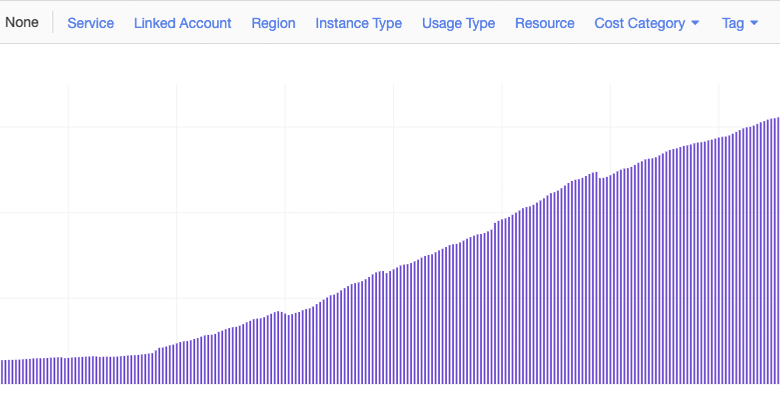
One of the benefits of dogfooding versions of your own software early is that you’re able to shake out the bugs before they hit the field and affect your customers. In this case, we root caused the issue to a software bug that had caused our garbage collection of expired snapshots to stop running correctly. By dogfooding, we were able to keep this bug from affecting our customers. Guess where in the graph below we deployed the fix.
Use APIs To Dig Deeper
The example above shows how important it is to have a mental model to validate the reality that your bottom line is experiencing via the bill. It’s also prudent to perform validation at the resource level.
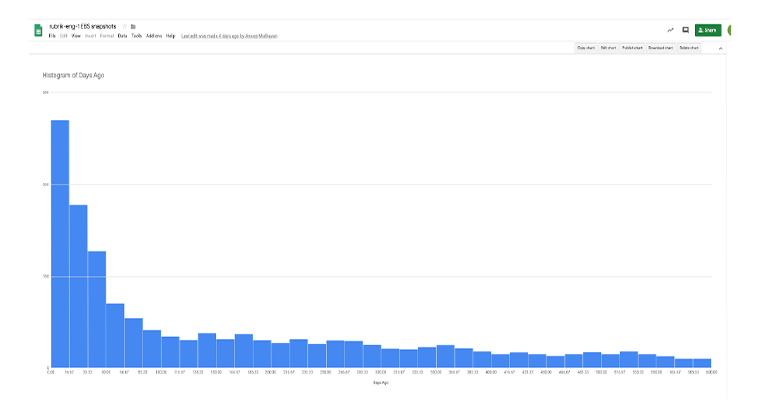
Given an SLA Domain, we have a clear understanding of what the distribution of snapshot age should look like. Using the example policy above, we might expect something like:
Reverse Hockey Stick
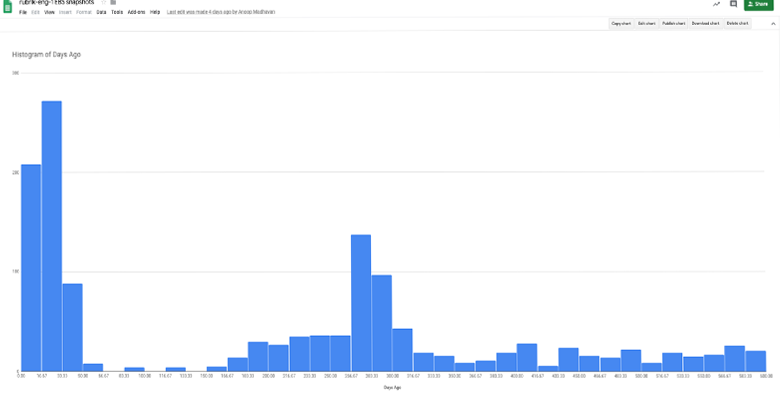
This is what you might call a (reverse) hockey stick. We used the EBS APIs to pull a list of snapshots in this account, including their creation time, then built a histogram by age.
When you ask for a hockey stick but end up with a camel
The root cause analysis here leads us to a much different type of error, and one we never would have discovered had we not dug into the data.
It turned out that at some point in the last year we switched our DevOps infrastructure backup from one instance of our Cloud Native Protection to another. Rubrik will not delete snapshots of an object that is removed from an SLA; customers consider this a feature and we consider it the right thing to do when it comes to your data. While we ceased taking new snapshots on the first instance, we did not explicitly clean up the old snapshots that were no longer necessary once the second instance has built up sufficient history.
And once the requisite cleanup actions were taken on the legacy system:
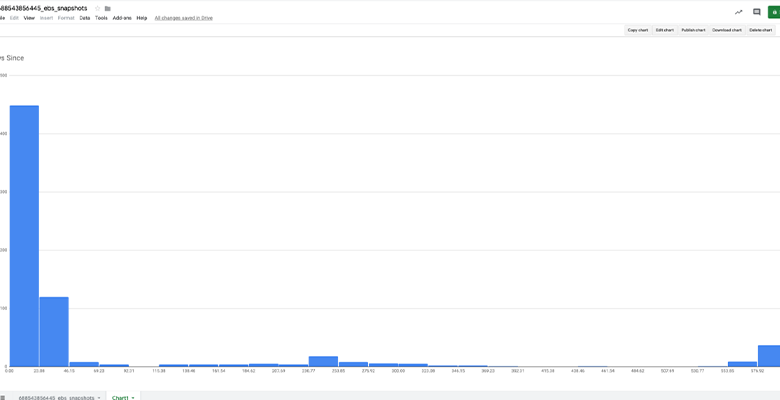
Still a few straggler snaps, but the picture looks much more in line with our hockey stick model.
How Process Failure Can Cost You
While understanding and modeling your spend is paramount, so is the process by which you manage your cloud accounts. Let’s use an analogy many of us can relate to: living in a multi-person household that shares ownership and accountability for chores. If as a group you forget to do something simple, like taking out the trash, you can end up with a smelly house.
Rubrik’s CloudOn architecture includes a set of cloud native images that orchestrate the instantiation of snapshots on the cloud environment. Our CI pipeline builds these images and pushes them into our cloud account.
For the images built by our master pipeline, we decided on a grace period of N days to allow downstream jobs and manual testing a grace period in which to qualify the image, after which the images become eligible for garbage collection. The policy was implemented by another periodic job in our CI/CD infrastructure that ran a script to scan the cloud images and delete anything outside of the grace period.
Given the above model, we’d expect a constant number of images: N days * M images / day. However, we got surprised by what looked like runaway spend:
The problem in this instance wasn’t technology but a process failure that resulted in an accumulation of garbage. The IT team that managed the account was told to keep hands off, as the cleanup policy required some custom logic to ensure images weren’t yanked out from under users. The feature team wrote a functionally correct cleanup script and deployed it into the CI/CD on a schedule, they even validated and tested the deployment with help of the DevOps team. Then, during some subsequent redeploy of the CI/CD, we unintentionally wiped out the job.
The IT team wasn’t tracking the account as they were no longer responsible for GC. The feature team stopped looking at the account as they had a cleanup script running on a set-it-and-forget-it schedule. The DevOps team wasn’t managing and likely didn’t have access to the account. When no one is looking, you end up with a stinky pile of garbage racking up a nice big bill.
While a clearer handoff of responsibility might have saved us, so too would have an alarm on the spend. Because in this case, we actually had a model upfront it would have been straightforward to implement an AWS budget complete with notifications.
(Re-)Architecture
So you’ve got your model in place, clear ownership, and even automated monitoring/enforcement via the budget, but your bills still seem too high. As you look at sources of spend, it’s also worth reexamining the motivation and driver of the spend in the first place.
Let’s use the prior section as an example: we generate and store cloud images for later consumption by tests.
As is common in CI/CD architectures, Rubrik has multiple pipelines running at varying cadences. We have a “master” pipeline, which is responsible for building our software and then running unit and e2e smoke tests. We also have more extensive qualification pipelines that utilize artifacts produced by the master pipeline, including our cloud qualification pipeline run against cloud images built by the master pipeline.
Our master pipeline now runs more than 10 times a day, whereas the extensive qualification pipelines run only every 3 days. In the span of 3 days, we generated 30 cloud images and used only 1: 30x more images than we actually needed.
The qualification pipeline takes about a day to complete. This means any image is in use for at most 1 day, yet we were unconditionally retaining it for 21 days: ~20x more snapshot hours than we actually needed.
Joining these two inefficiencies, we can see that we were consuming almost 600x more snapshot hours than our pipelines actually required!
A simple re-architecture of our pipelines:
- Move cloud image generation out of master pipeline to the head of cloud image pipeline
- Delete cloud images at end of cloud pipeline
Voila, 600x savings!
Conclusion
In summary, we believe that diving into your infrastructure and building an understanding of what you’re running and why is paramount to reigning in your costs. Optimization from the outside (Savings Plans, Right Sizing, etc.) is possible and can make a dent, but building a model from within can unlock opportunities to cull and or re-architect with large returns.
