Analytics Reporting
Uncover Insights Across Your Environment
Rubrik delivers analytics on data management, compliance, and capacity utilization across your global distributed environment.
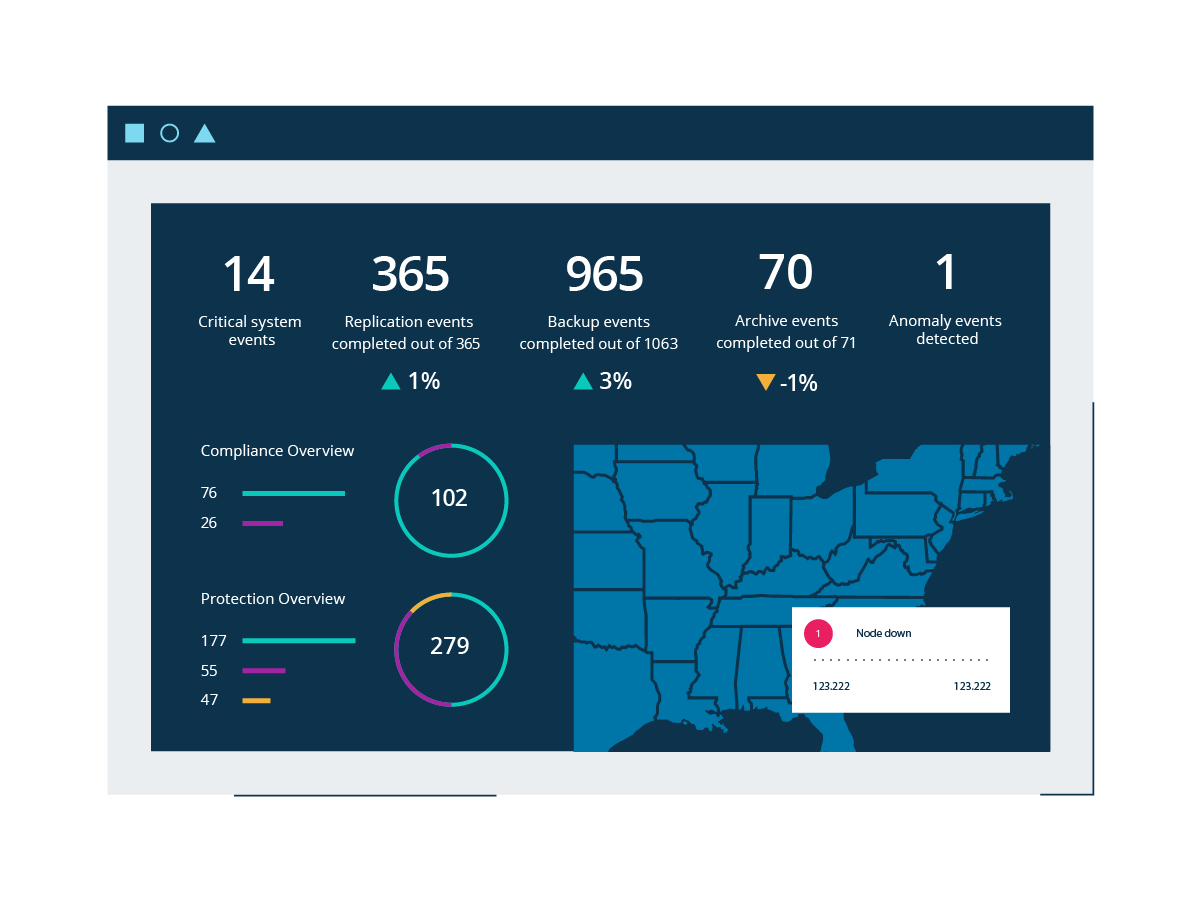
Data Intelligence at Scale
Generate rich custom dashboards in minutes. Unlock actionable insights on infrastructure health and behavior across your multi-cloud environment.
Real-time Analysis
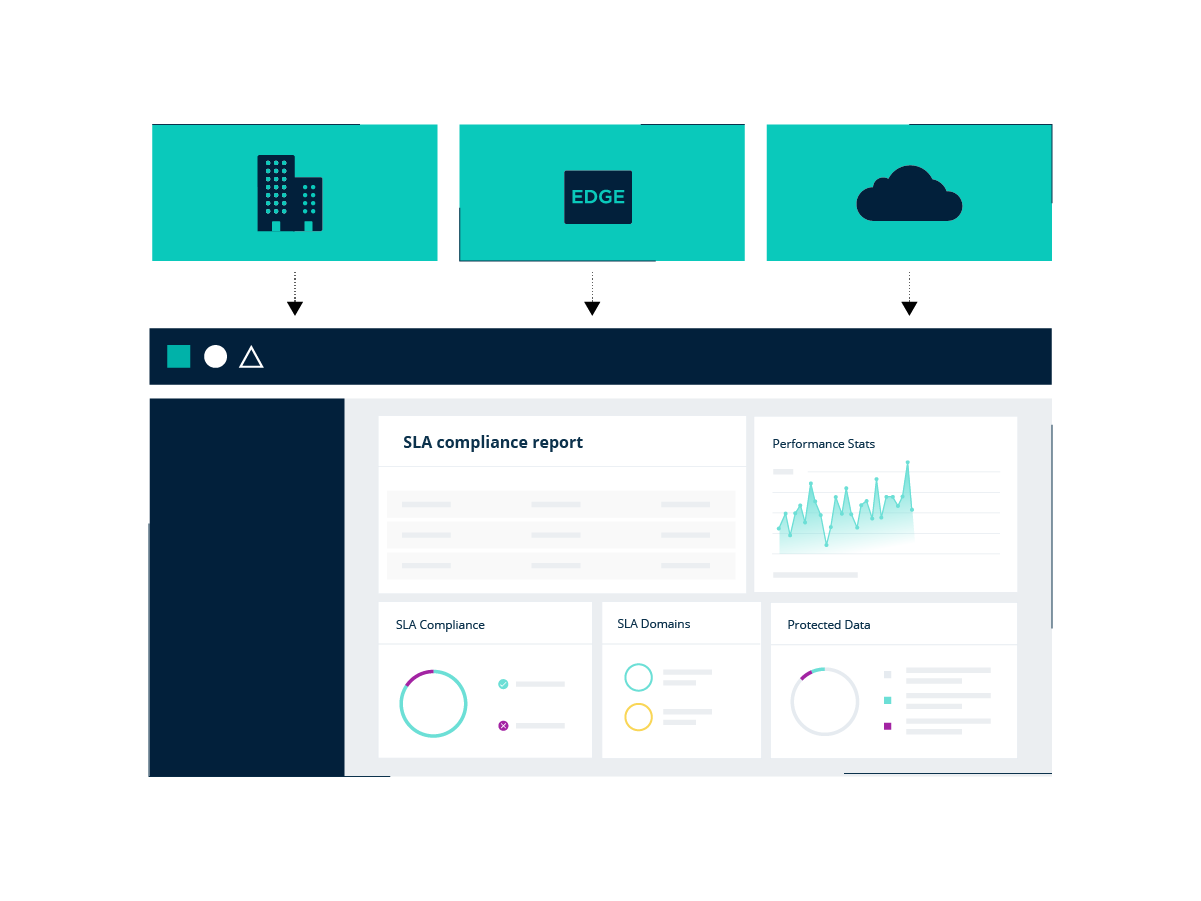
Single Pane of Glass
Customized Reporting
Use the provided reporting templates, or create, customize, and share your own dashboards.
The Definitive Guide to Rubrik CDM
Learn how customers leverage Rubrik for disaster recovery, self-service management, ransomware defense, and more.
Workload Behavior Analysis
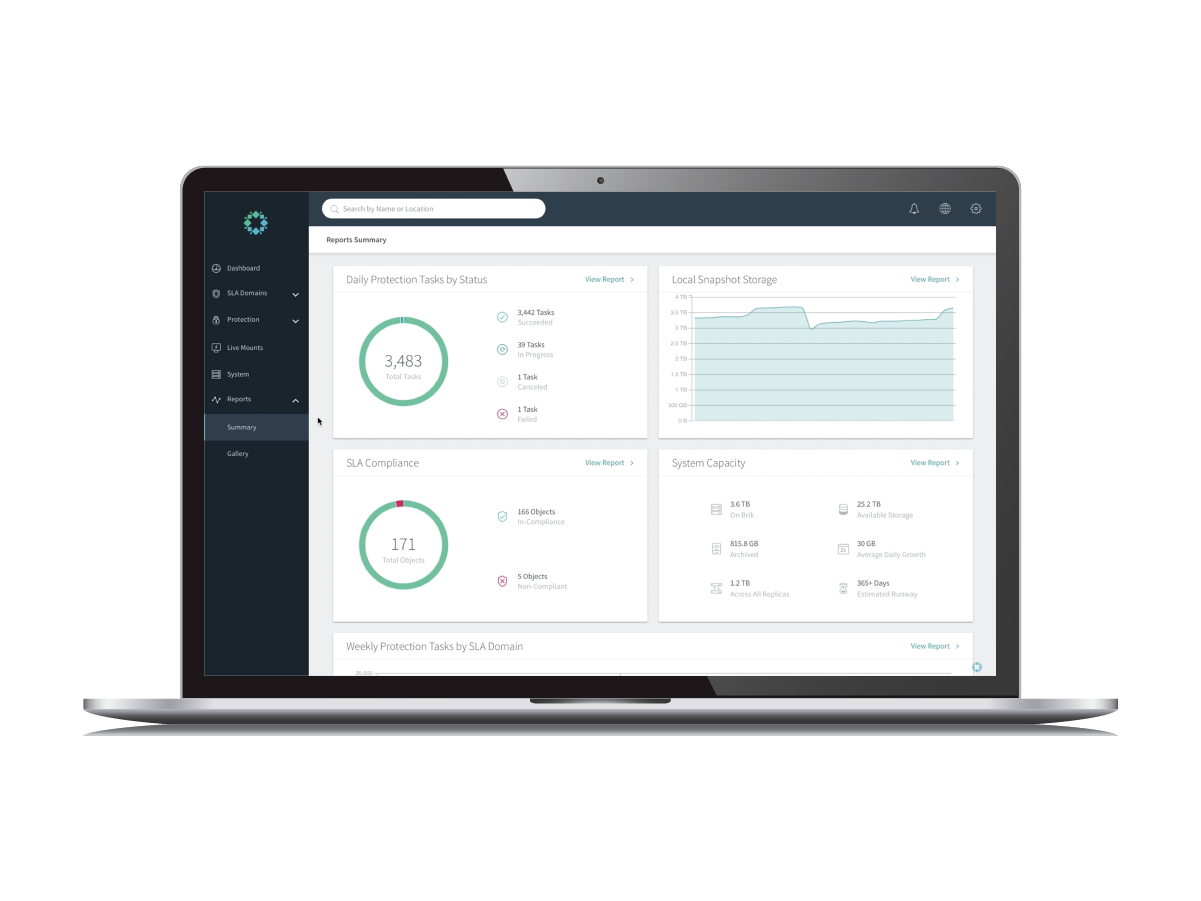
Track capacity utilization, data growth, and usage by application, location, or use case with runway projections over a defined time period.
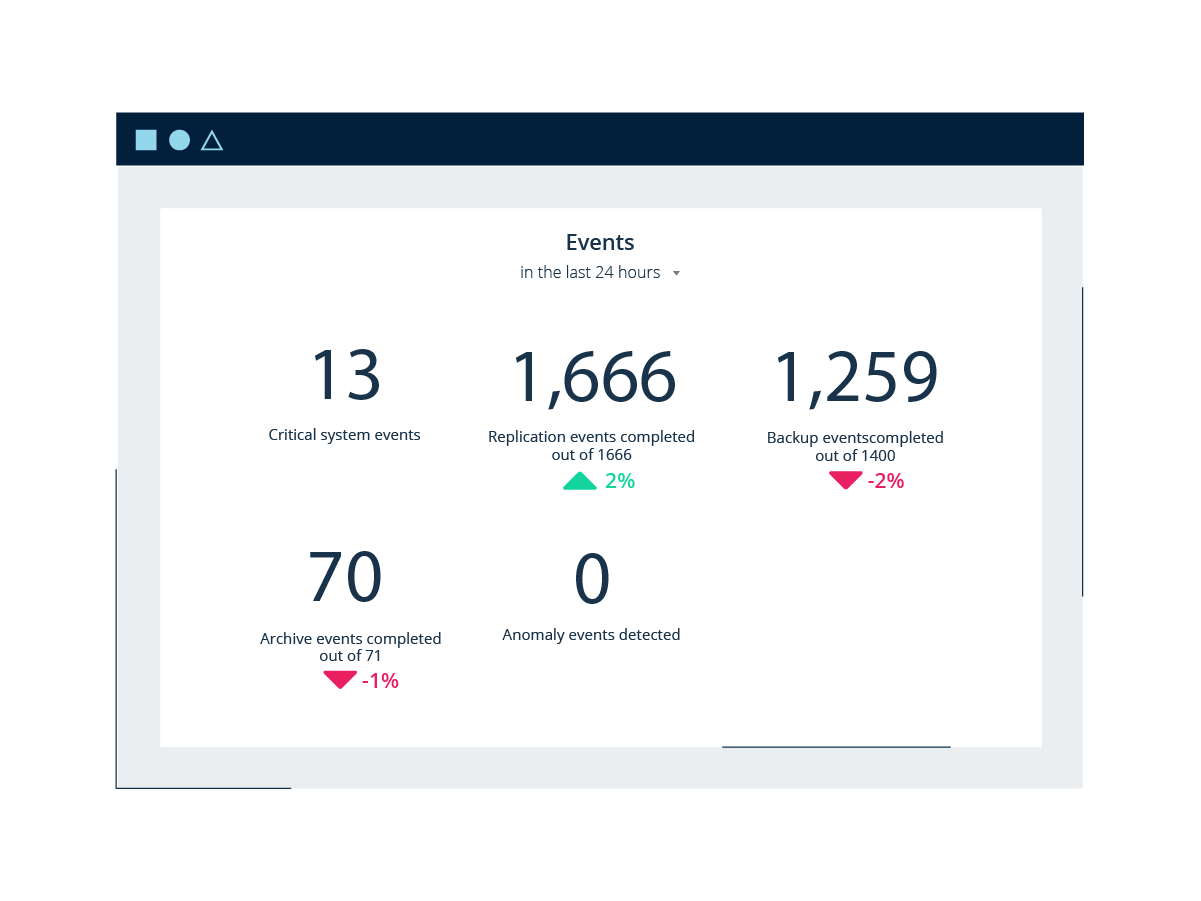
Compliance Visibility
Determine SLA compliant applications at-a-glance across all Rubrik sites. Easily search and filter to quickly produce records demonstrating SLA compliance.
Performance Optimization
Plan for capacity and enhance performance to reduce cost. Track compliance based on SLAs and organizational goals.

blogpost | 11 min read | Jul 15, 2020
Be Data-Forward: Embrace a Hybrid Cloud Data Management Strategy
Get a glimpse into the hybrid cloud and data protection trends that will be evolving over the next 12 to 24 months.

datasheet | Data sheet,Google Cloud,Multiple use cases | Data sheet
Rubrik for Google Cloud
Learn how Rubrik provides cost-effective data archival and automated cloud-native protection for workloads running in Google Cloud.
Ready to get started?
Get a personalized demo of the Rubrik Zero Trust Data Security platform.

